Trading is no longer a hidden cache; many people have turned into day traders by investing in share markets for-profits, long-term investments, and entertainment. Based on more than 100 Japanese candlestick patterns, a morning star candlestick pattern is considered one complex formation. The occurrence of the morning star candlestick pattern is less frequent as compared to a single candle formation. However, it is a powerful trading concept with high predictive value and positive returns. Keep reading this blog to understand how to trade on a morning star candlestick pattern and effectively earn profits!
What is a Morning Star Candlestick Pattern?
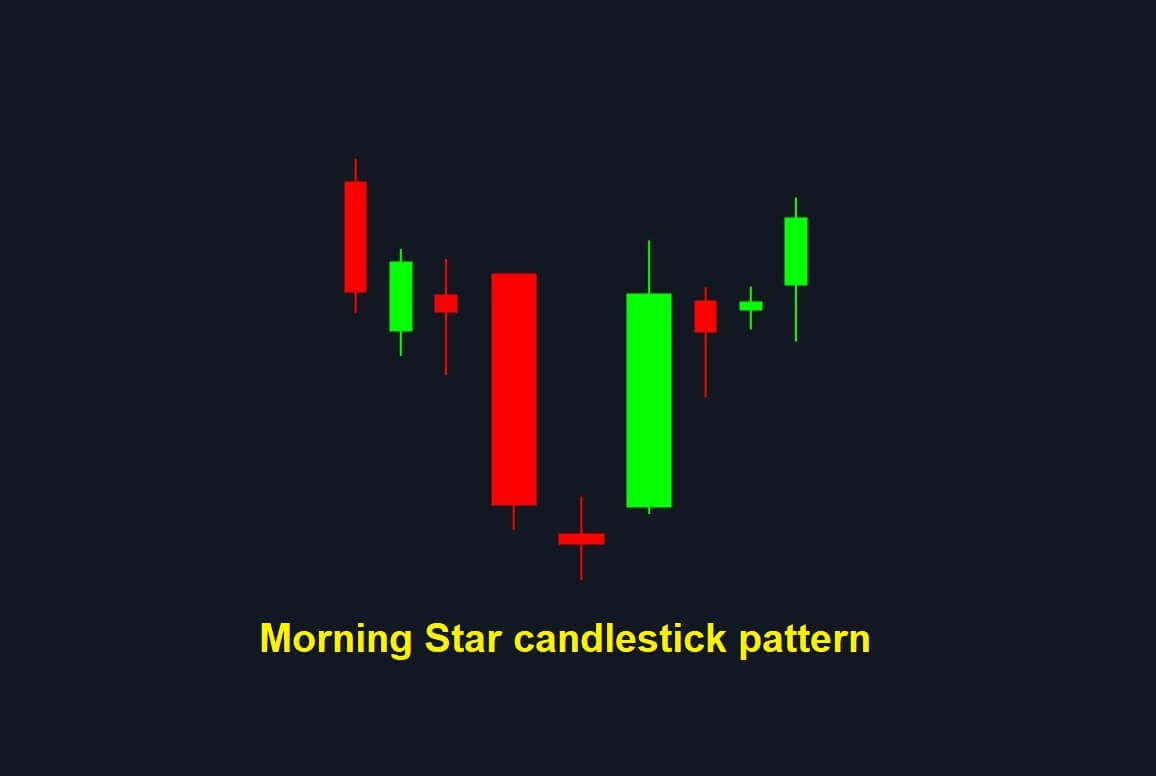
A morning star contains three candlesticks that are decoded as a bullish sign by financial and technical experts. Similar to flag pattern charts, it is an integral part of technical analysis. It is a downtrend reversal pattern formed by combining three consecutive candlesticks. This downward trend in the morning star indicates the start of an upward climb. Traders keep a thorough check at this formation, expecting a potential reversal, which other indicators can confirm.
Significance of Morning Star
The Morning star pattern is a significant indicator of a trend reversal. The volume on the reversal candle helps traders to identify a possible rise in the upcoming market sessions. One of the most excellent features of the morning star pattern is that it can drive price alone without the support of other indicators.
Elements to consider for the morning star pattern
- The first candle should be a long bearish candle.
- The second candle should be indecisive about balancing the session.
- The third candle should be a more substantial bullish candle which preferably confirms the reversal.
- Since a morning star is a bullish reversal pattern, the downtrend must be in place.
What does a morning Star tell you?
With a three-candlestick pattern with a low point on the second candle, a morning star is a visual pattern with no calculations to be performed. The low point in the morning star is only visible after the close of the third candle. Few technical indicators can help you forecast the morning star formation by Relative Strength indicator (RSI), indicating that the stock or commodity is oversold or a price action near its support zone.
How to trade a Morning Star?
The fundamental method to start trading a morning star is first to confirm it! You can begin by observing the patterns and noticing what happens in the session after a convention. A visual sign of trend reversal from bearish to bullish followed by other technical indicators is a solid move to continue your trading. You can also follow up with the volume contributing to the subsequent pattern formation. Watching the volume increase through three sessions making a pattern will give you an idea of a pattern formed on the third day. Regardless of other technical indicators, as a trader, you can take up bullish positions in stock or commodity riding the uptrend until there’s an indication of a reversal.
Know when to Stop!
A morning star pattern is best when backed up by other strong indications such as volume and support level. Making your entire decision on the basis of a visual design can be a risky deal. Place your stop where the pattern indicates that it has failed. If the market drops below this level, you probably might not expect a profit.
The bottom line
Despite what you have learned through this blog, it is essential to implement it in the practical world to understand and trade better. Theoretical knowledge is not enough for trading; demonstrating the strike and patterns and studying Indian markets is equally important. You can start by practicing, and when you progress, you will eventually develop trades and a trading strategy system. This practice will help you in abandoning long-term failure and will encourage a high win rate system.


