Improvements made to 2020 Census data collection provides a more accurate depiction of how Asian Americans self-identify
India Post News Service
The U.S. Census Bureau continues to release information from the 2020 Census in order to provide rich information about the changing population of the United States. From the apportionment counts data in April to the redistricting data in August, each data set from the 2020 Census has progressively unveiled insights about the Asian American community.
According to recent redistricting data results from the 2020 Census, there was a noticeable increase in the Asian-specific populations. Over 24 million people (7.2% of the total population) identified as “Asian alone or in combination.” “Asian alone” refers to people who reported Asian and did not report any other race. “Asian alone or in combination” consists of those respondents who reported Asian, whether or not they reported any other races.
The Asian alone population grew by 35.5% between 2010 and 2020. Approximately 19.9 million people (6% of all respondents) identified as Asian alone in 2020, up from 14.7 million people (4.8%) in 2010.

Hawaii, California, Washington, Nevada, New Jersey, New York, Virginia, Alaska, Massachusetts, and Maryland were the states with the largest percentages of the Asian alone or in combination populations. The 10 states with the largest percentage increase in the Asian alone or in combination population are North Dakota, South Dakota, Nebraska, District of Columbia, North Carolina, Indiana, Texas, South Carolina, Montana, and Utah.In comparison, the Asian in combination population grew by 55.5%. Approximately 4.1 million people identified as Asian in combination in 2020, up from 2.6 million people in 2010. Approximately 2.7 million people identified as Asian and White, making it the largest Multiracial Asian group.
The new data reflects changes in the population and the improvements in how the Census asked the questions and captured and coded the responses, a process that has changed nearly every decade throughout the history of the Census to reflect social, political and economic factors.
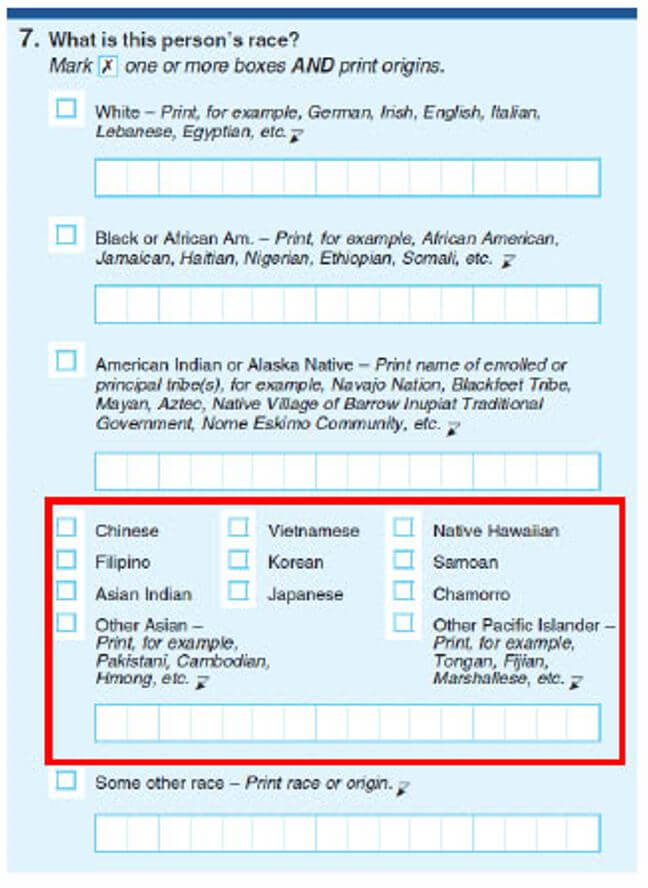
“We’ve made several design improvements to the race question for the 2020 Census based on the research over the past decade,” said Rachel Marks, Branch Chief, Racial Statistics Branch at the Census Bureau’s Population Division. “One of the major changes was adding dedicated write-in response areas and examples for the ‘White’ and the ‘Black or African American’ racial categories, and we also added examples to the ‘American Indian or Alaska Native’ racial category. [For] the Asian and Native Hawaiian and Other Pacific Islander categories, we reordered the detailed Asian and Native Hawaiian and Other Pacific Islander checkboxes by population size. And in the Native Hawaiian and Other Pacific Islander category, we changed the checkbox category ‘Guamanian or Chamorro’ to ‘Chamorro’ based on feedback and research.”
 In order to provide the public with detailed information more frequently, data that were historically collected only once every 10 years by the decennial census long form is released annually through the American Community Survey (ACS). The Census Bureau also releases other data products such as the Demographic and Housing Characteristics file (DHC) and the Detailed Demographic and Housing Characteristics file (Detailed DHC).The changes provide a more thorough and accurate depiction of how people self-identify. The re-ordered checkboxes for Asian and Native Hawaiian or Pacific Islander by population size are: Chinese, Filipino, Asian Indian, Other Asian (for example, Pakistani, Cambodian, Hmong, etc.), Vietnamese, Korean, Japanese, Native Hawaiian, Samoan, Chamorro, Other Pacific Islander (for example, Tongan, Fijian, Marshallese, etc.).
“We have a lot more data to release in the future from the 2020 Census,” said Nicholas Jones, Director and Senior Advisor of Race and Ethnic Research and Outreach at the Census Bureau’s Population Division. “The Detailed DHC will include tables on detailed racial populations. This is where you’ll be able to get data on detailed Asian groups, such as Chinese, Korean, Thai, Vietnamese, Asian Indian, and many more.” Some examples include demographic and housing characteristics for sex and age, household and family type, and tenure (whether a housing unit is owner-occupied or renter-occupied).
“The Census isn’t something that we conduct or something that is done to you, it’s something the American public participates in,” said Michael Cook, Chief of the Public Information Office at the U.S. Census Bureau. “It’s a big effort, and it’s an effort that is done in concert with many partners that have helped us reach each and every community to ensure that people know the value, the importance, of conducting the Census.”
For more information, visit census.gov/2020results.


