
Amit Inamdar
The economic disruption caused by COVID-19 is truly without precedent. The past two months have been very uncertain and it has been difficult to ascertain the real estate markets in the Bay Area.
Apparently, our area with major tech employment seems to be immune to the housing crisis. Buyer activity has been strong, not only during the early part of the second quarter, but also having picked up in the month of June. So if buyers are buying, where are they rushing to buy?
 The homebuyer affordability will always drive buyers to the next real estate market. Affordability is a combination of home price as well as the mortgage interest rates. With the recent drop in interest rates, affordability has gone up for many homebuyers. Additionally, the recent SIP orders have caused many to feel stuck in a small place and they want to own a home even more. With many retail outlets closed, the consumer has added savings to feel comfortable to invest in their own homeownership journey.
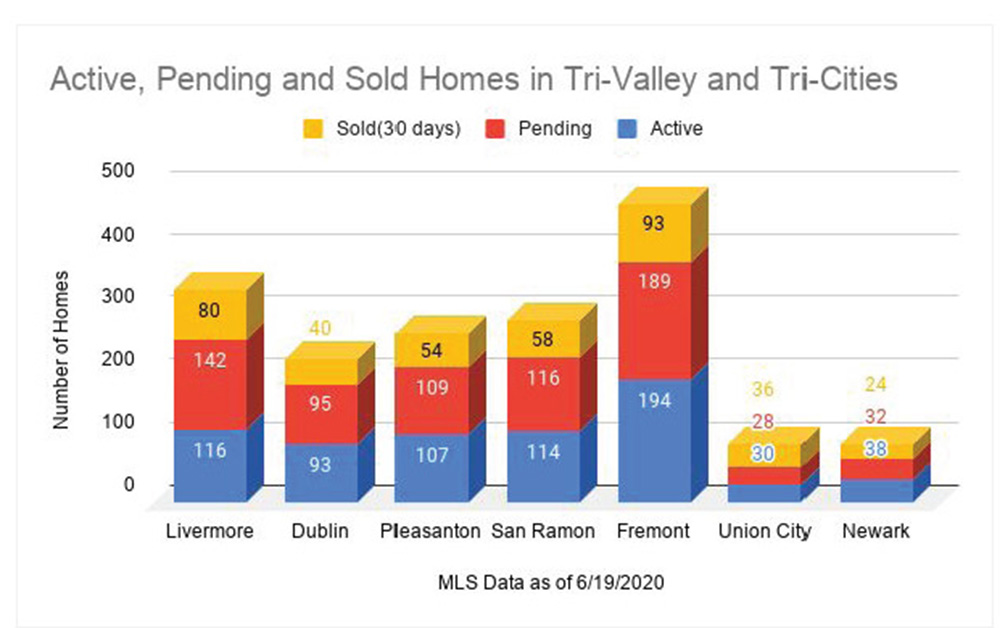
Even though homebuyers may not fully grasp the concept of affordability, they can direct themselves to the neighborhoods with lower prices. The following chart shows the available inventory in Tri-cities (Fremont, Union City, Newark) and Tri-valley cities (Livermore, Dublin, Pleasanton, San Ramon).
Active listings are the homes available for sale in the market, the pending listings are listings in contract, and sold listings shown are the listings sold in the last 30 days. These inventory levels can be tied to the size of the city’s population, however, it can also show the cities where there is more home buying activity. Pending listings indicate the demand in the marketplace and active listings indicate the supply of homes. One can derive a ratio of pending homes to the active homes to determine the market hotness index. Additionally, we can take a ratio of active homes to sold homes to understand the months of available inventory.
It is interesting to note that the hottest of the markets today are in the Tri-valley areas with Livermore being the most desirable city, as shown in the graph by the red bars. The number of pending listings (demand) are 22% higher than the number of available homes for sale (supply). As long as this ratio is above 0.5%, the markets are considered hot. Even though all the markets in Tri-cities and Tri-Valley cities are hot, there seems to be a rush to move to Tri-Valley cities. The green bars in the graph show the months of available inventory, indicating the market still belongs to the sellers.
Typically, if the market has more than 6 months of inventory, then the buyers have their way and it is a buyer’s market.
As the median price of the home in Livermore is $810,000, it is understandable for buyers to flock to this affordable neighborhood. You do get more for your money in the Tri-Valley cities.
Experience shows that when you move away from the Silicon Valley, you get bigger homes for a lesser price. Do note that the median home price as of May 2020 is shown underneath the city name in the Hot Market graph. It is interesting to note that buyers may compromise commutes for an affordable home buying experience.
This market activity analysis is important for both buyers and sellers. Without the activity analysis, a listing agent may underprice the home and sell it too cheap by leaving money on the table. Such analysis helps buyers make competitive offers that may lead to winning bids. Agents who help their clients with detailed market analysis always help them save money.
Just like we found hot cities using our analysis, we can also find hot neighborhoods within the city. This will help you invest in the right neighborhood as a buyer. For sellers, it will help sell your home for the highest price in the shortest time. You can get your market guidance and winning strategies just by calling Realtor Amit Inamdar at (510) 364 6686. CA DRE 0135522.


